

By Joseph D’Aleo, Fosters, Sunday, April 24, 2011
The State Senate is considering a bill (HB 519) that passed the House, which pulls the state of New Hampshire out of the Regional Greenhouse Gas Initiative (RGGI) - the Northeast’s own version of “Cap and Trade.” Our senators should support this bill and get this state out of the program.
Participation in this plan over the past several years has cost family households in the state millions of dollars in higher electricity bills. The argument to justify this “tax” is that it funds “green energy” projects that will create jobs here in the state.
This is one of the biggest canards used to make people feel better about paying higher taxes and letting the government spend their money. Every program that big government supporters propose these days is put in the context of saving or creating jobs. This is the same language the Democrats used to get the stimulus bill passed which didn’t really impact the unemployment rate, but did result in huge deficits and debts. So what kind of job creation comes about when government enacts the type of “green energy” programs that RGGI funds? Fortunately there are numerous examples to look at.
One of the biggest green energy job creation programs in the world was enacted in Spain in the late 1990s. A study was performed in 2009 that looked at how well the program worked, as well as the economic impacts of Spain’s Renewable Energy program. The results should give every elected official pause before advocating for a similar program.
Some of the highlights of the study:
- Only one out of every ten “green jobs” was of a permanent nature that operated and maintained renewable energy resources. The rest were mostly temporary jobs for construction, installation, project engineering or marketing.
- The cost of each of these green jobs - both the temporary and the permanent ones - was over $750,000 per job.
- Worst of all, the study indicated that every green job created by the programs resulted in the destruction of 2.2 jobs in the private sector.
A similar study in Italy came up with a conclusion that 4.8 private sector jobs were destroyed to create each green job in that country. Like the Spanish program, each green job cost between $700,000 and $1.7 million.
We should not be surprised by these results. This is yet another example of government-imposed tax proceeds given to bureaucrats to pick winners and losers in an industry that is not economically viable on its own. In order to subsidize the “job creation” they have to take money out of the private sector. That is money which could have created jobs at a manufacturer, a hospital or numerous other industries. The result is insanely expensive job subsidies that provide little economic value while destroying jobs in the private sector. Why would we want to keep this type of program alive in New Hampshire?
Yes, each of us only pays a small amount to fund these programs, but this is no different from the programs that have failed in other places. What is worse is that some states have redirected the RGGI funds to help balance their budgets - which was one of the concerns opponents of RGGI raised in the first place. So in addition to keeping job-destroying subsidized industries afloat, the government can raid the fund for general operations.
What reasons are left to keep this state in RGGI? Supporters of the program can’t argue that it is to create green jobs. Numerous studies have debunked that notion. There is a tendency of the government to raid the funds as well, so that is another strike against it.
Of course, the other argument to continue RGGI is the idea that regulating CO2 will help combat global warming. This space doesn’t allow for a comprehensive discussion on the science, but let me show the readers some information in which they may not be aware.
There is no question that atmospheric CO2 levels have risen over the last century but it’s clear that temperatures in this state have not changed significantly over that time. In New Hampshire, temperatures have exhibited cyclical changes over the past 80 years, but without any significant warming (graph source NOAA NCDC).
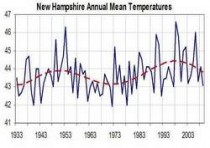
Global Warming appears to be passing New Hampshire by, and if you look at data from other regions you will find similar trends.
I encourage our state senators to look at the studies and understand the data as they consider the bill to repeal RGGI. If similar programs like RGGI are destroying jobs to grossly subsidize the few permanent “green jobs” they create, if the environmental benefits of RGGI are speculative at best, and all we are doing is creating a pot of money for the state to raid - then there should be no doubt that the state should get out of RGGI now.
Joseph D’Aleo was the first Director of Meteorology at the Weather Channel and has over 30 years experience in professional meteorology. Mr. D’Aleo is a long time resident of Hudson.
See Ric Werme’s site on RGGI here. Here is a copy of my submitted senate testimony with links.
By Paul C. Knappenberger for SPPI
On March 8, 2011, Dr. Richard Somerville supplied written testimony to the U.S House of Representatives Committee on Energy and Commerce Subcommittee on Energy and Power. Dr. Somerville’s testimony was an eloquently packaged collection of general alarmist talking points that closely follows his 2009 Copenhagen Diagnosis. It consists of a selective presentation of post-AR4 findings on climate change - carefully groomed to forward his point of view that disaster is imminently upon us if large and drastic cuts in greenhouse gases emissions are not immediately undertaken.
However, a more restrained look at the scientific literature, the collection of observations, and model performance evaluation reveals a much less desperate situation - one which, in fact, is suggestive of net gains (environmental, social, economic) rather then losses from the burning of fossil fuels. In the comments that follow, we point out the most egregious examples of selective presentation of the science within Dr. Somerville’s testimony.
Of note, Dr. Somerville, provides these cautionary words in his testimony: “Choosing to make selective choices among competing evidence, so as to emphasize those results that support a given position, while ignoring or dismissing any findings that do not support it, is a practice known as “cherry picking” and is a hallmark of poor science or pseudo-science.” - Richard Somerville, Testimony before the U.S House of Representatives Committee on Energy and Commerce Subcommittee on Energy and Power, March 8, 2011. Yet, throughout his testimony, Dr. Somerville relies on this very tactic. We illustrate Dr. Somerville’s reliance on “cherry picking” in the following examples in which we highlight passages from his written testimony and then present evidence that shows that the situation is either more complex or, in some cases, completely opposite to that put forward by Dr. Somerville.
Dr. Somerville:
“In early 2007, at the time of the publication of WG1 of AR4, the mainstream global community of climate scientists already understood from the most recent research that the latest observations of climate change were disquieting. In the words of a research paper published at the same time as the release of AR4 WG1, a paper for which I am a co-author, ‘observational data underscore the concerns about global climate change. Previous projections, as summarized by IPCC, have not exaggerated but may in some respects even have underestimated the change’ (Rahmstorf et al. 2007).”
REALITY:
At the time of the publication of the paper that Dr. Somerville was a co-author on (Rahmstorf et al., 2007) it was already obvious that there was a slowdown occurring in the rate of global temperature rise. This slowdown has continued up to the present (including the time of Dr. Somerville’s recent testimony). Instead of global temperatures increasing at a rate that is greater than the average rate projected by the climate models incorporated in the IPCC Fourth Assessment Report (AR4), in fact, the rate of global warming is occurring at a much slower rate than projected. So slow in fact, for the past 15 years, the rate of rise is statistically indistinguishable from zero in some datasets. This fact, developed solely from observations, stands in stark contrast to both Dr. Somerville’s scientific paper as well as his testimony.
And the rate of sea level rise has been slowing as well. While at the time of Somerville’s 2007 paper, the current rate of decadal sea level rise was near the high end of the IPCC projections, since then, the rate of sea level rise has slowed, and at the time of his testimony, the current decadal rate of sea level rise is now very close to the middle of the IPCC projected range.
Thus, based on current global temperature trends and current trends in the rate of global sea level rise, the rate of climate change has not been underestimated as was claimed by Dr. Somerville in his testimony but instead in some cases, has been exaggerated. Thus, Somerville’s “concerns about global climate change” are no longer well-grounded in his research that he cited to substantiate them.
Dr. Somerville:
The long-term trend is clearly still a warming trend (NASA Goddard Institute for Space Studies, 2009). Its magnitude is about 0.2 degrees Celsius per decade, consistent with IPCC AR4 projections. This is equivalent to about one third of a degree Fahrenheit per decade.
REALITY:
The long-term trend over the past 30 years in the NASA Goddard record is actually 0.175C/decade, a value that lies below the IPCC projected temperature trends for that same period. There are also other compilations of the global surface temperatures in common usage including the record complied by the U.K.’s Hadley Centre. Using that record, the trend over the past 30 years (1981-2010) is 0.165C/decade, a value even further below the IPCC projections. And that rate of increase has been on the decline. Over the past 15 years, the trend is 0.10C/decade, over the last 10 years the trend disappears completely (-0.00C/decade). The consistency of these observations with climate model projections is shaky at best.
Reference:
U.K. Met Office Hadley Centre observations datasets, global average temperature
Read much more here.
It took 16 months after Climategate for the mainstream media admit to its existence...except for some passing references to the whitewashes of the University that was ground zero, the University of East Anglia by biased panels. See in this James Delingpole piece how the University efforts to stop Delingpole and others from covering the scandal failed. Meanwhile Michael Mann front and center in this story in going after his critics in the court and solicited the help of the university professors, Union of Concerned Scientists, ACLU and other liberal groups to try and block UVA FOIA release of Mann’s emails while at UVA. He is now at PSU. These groups were silent when Greenpeace forced FOIAs on UVA’s Pat Michaels, David Legates at UDel and Dr Willie Soon at Harvard.
By Kate Sheppard, Mother Jones News
IT’S DIFFICULT TO IMAGINE how a guy who spends most of his time looking at endless columns of temperature records became a “fucking terrorist,” “killer,” or “one-world-government socialist.” It’s even harder when you meet Michael Mann, a balding 45-year-old climate scientist who speaks haltingly and has a habit of nervously clearing his throat. And when you realize that the reason for all the hostility is a 12-year-old chart, it seems more than a little surreal.
Back in 1999, Mann - then a newly minted Ph.D. (PDF) - and a pair of colleagues constructed a chart that plotted historical climate data, spanning from 1000 to 1980. Because recorded temperatures only begin in the late 19th century, Mann and his team largely relied on so-called proxy records - measurements of tree rings, coral, and ice cores whose variations illustrate temperature changes over the years. The graph showed that after nearly 900 years of relatively stable temperatures, there was a sharp uptick starting in the 20th century.
You may have seen a version of the graph, known as the “hockey stick,” in the film An Inconvenient Truth - the rise in carbon dioxide levels* is so steep, Al Gore uses a mechanical ladder to reach the most recent readings. The graph was featured prominently in a seminal 2001 report from the United Nations’ Intergovernmental Panel on Climate Change (IPCC) that concluded, for its first time, that “the balance of evidence suggests a discernible human influence on global climate.”
The film and the IPCC report made the chart famous, but Mann’s version (PDF) appeared in the journal Geophysical Research Letters. There, he and his colleagues explained the complex methodology, and the uncertainties, involved in their study; but let’s face it, phrases like “multiproxy data network” and “extensive cross-validation experiments” are lost on most of us. “This,” Mann says with an upward swoop of the arm, “the public understands.” The chart tells “a very simple story."Watch our video on how we fact-checked the hockey stick graph.
In fact, some complained that it was too simple, glossing over uncertainties in historical climate readings in order to make a more dramatic point. Yet numerous other reconstructions of historical temperature records made since Mann’s graph have also shown a dramatic uptick in the 20th century, and a 2006 assessment from the National Academy of Sciences concluded (PDF) that while Mann’s methodology wasn’t perfect, the story the chart told was accurate.
Yet global warming skeptics have made the graph exhibit A in their cause. Congressional hearings have focused on it, and it has been the impetus for multiple critical books and blog posts. Skeptics have dismissed the graph as “little more than paleo-phrenology” and claimed that “Mann-made warming is real, while man-made warming remains at best a theory, more likely a hypothesis.”
And Mann himself has become a target. Virginia’s crusading Republican attorney general has suggested that he may have committed research “fraud.” The 2011 Conservative Political Action Conference had a booth where attendees could throw eggs at his picture. There was a flood of hate mail, much of it containing death threats: “Your work is finished. YOU ARE GOING TO HANG SOON!”
There was a flood of hate mail, much of it containing death threats: “Your work is finished. YOU ARE GOING TO HANG SOON!""Climate science has basically been at the receiving end of the best-funded, best-organized smear campaign by the wealthiest industry that the Earth has ever known - that’s the bottom line,” Mann told me when I visited him at his Penn State office last November. Near his desk, Mann keeps an actual hockey stick, signed by Middlebury College’s championship hockey team to show the school’s support for his work.
Things really heated up for Mann in late 2009, when more than 1,000 emails from him and other climate scientists were lifted from a server at the Climatic Research Unit (CRU) of the UK’s University of East Anglia, the world’s leading research institution focused on climate change. The emails offered a window into the climate-science bunker, with a view of Mann and his fellow researchers growing increasingly defensive. One scientist wrote that he was “tempted to beat the crap out of” a skeptic at the libertarian Cato Institute. Another joked that the way to deal with skeptics was “continuing to publish quality work in quality journals (or calling in a Mafia hit).” Scientists suggested that they would rather destroy data than provide them to their critics. They also discussed using “tricks” in their research, debated how to frame uncertainties in some of their data, and attempted to control access to peer-reviewed journals.
Click here to see our timeline of the Climategate scandal.
Within days, the heist - soon dubbed “Climategate” - was all over the news. Glenn Beck called it a “potentially major scandal”; Fox News crowed that the emails “undercut the whole scientific claim for man’s impact on global warming.” Rep. James Sensenbrenner (R-Wis.) decried (PDF) them as evidence of “scientific fascism.”
The immediate impact on public opinion was dramatic. A poll by Yale and George Mason University (GMU) found that in November 2008, 71 percent of respondents agreed that the planet is warming (PDF). Five weeks after Climategate, only 57 percent believed it. The emails, said a Yale report (PDF), had “a significant effect on public beliefs in global warming and trust in scientists.”
IF A SINGLE PERSON CAN BE credited with setting the stage for Climategate, it’s Stephen McIntyre, the retired mining consultant behind the popular skeptic blog Climate Audit. Over the past decade, McIntyre has built a reputation for finding methodological errors - some real, some perceived - in climate studies. The Wall Street Journal heralded McIntyre as “global warming’s most dangerous apostate.”
Indeed, McIntyre has made goading scientists - particularly Mann-close to a full-time job. Like Mann, McIntyre is genial in interviews, but on his blog, his tone toward the scientists targeted by his audits ranges from inquisitive to openly hostile.
The 63-year-old squash enthusiast from Toronto made his money in mining. He has also consulted for the Canadian oil and gas exploration company CGX Energy. He says his mining ties don’t affect his views on climate change and insists that his prolific blogging on the topic has not benefited him financially - rather, it’s taken time away from more profitable business.
See much more here.